Artist

ABBA

Pop · Sweden · 1972

high confidence

artist-side split is modeled + gross catalog revenue is separated. Why?

The primary figure is the modeled artist-side or estate-side annual cut, not gross catalog revenue.

Modeled artist-side range $4.4M-$14M/year
Gross catalog revenue $12M-$39M/year
Ownership context Included below
Last updated May 26, 2026
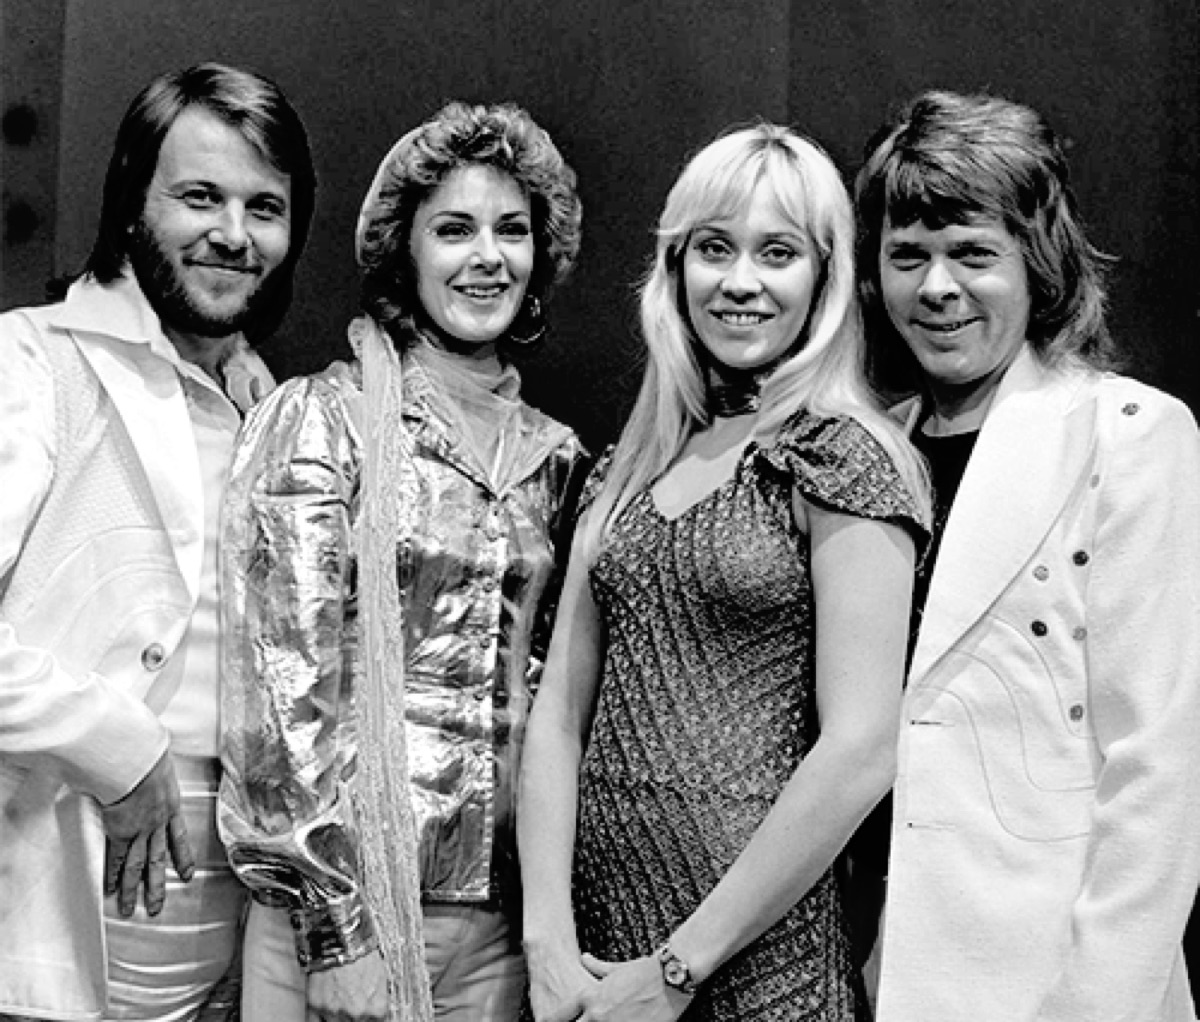
ABBA appearing on TopPop in 1974

ABBA remains one of the strongest evergreen pop catalogs in the world, with constant playlist use, film and theater association, and broad nostalgic replay.

Artist image source: Wikimedia Commons

Short Answer

How much money does ABBA make?

ABBA is modeled at $4.4M-$14M/year per year on the artist side, with gross catalog revenue and ownership context separated below.

Takeaway: ABBA works as a durable earnings page because the artist-side estimate, ownership context, and gross catalog framing can all be separated cleanly.

ABBA is modeled at $4.4M-$14M/year per year on the artist side, with catalog, label, publishing, and writer economics separated where possible.

Did You Know?

  • Currently ranks around the top 19% of tracked artists by modeled artist-side earnings
  • Active since 1972 and still commercially relevant roughly 54 years later
  • 2 tracked top songs currently support this page
  • Pop remains the clearest genre lane for this catalog
  • high confidence estimate

Why This Catalog Still Works

  • Repeat streaming and playlist familiarity help the biggest songs keep earning after release.
  • Broad recognition supports social reuse, rediscovery, and steady catalog listening.
  • Licensing and event-driven playback can create recurring spikes.

ABBA sits in the top 19% of tracked artists on the site by modeled artist-side earnings.

How It Compares

ABBA is compared against nearby artists in the catalog based on genre, country, era, and modeled earnings range.

Artist Why compare Estimated yearly midpoint
ABBA
current page
Pop · Sweden $9,200,000
Michael Jackson
same era
same era $32,000,000
Queen
same era
same era $16,450,000
Prince
same era
same era $10,700,000

Revenue Breakdown

Gross catalog revenue $12M-$39M/year
100% of the lead revenue lane
Artist-side share $4.4M-$14M/year
36% of the lead revenue lane
Label share $4.2M-$13M/year
34% of the lead revenue lane
Publisher share $1.2M-$3.9M/year
18% of the lead revenue lane
Writer share $1.8M-$5.9M/year
18% of the lead revenue lane

Bars reflect modeled annual midpoint ranges, not audited royalty statements.

More Questions About ABBA

How much does ABBA make in a year?

ABBA is modeled at $4.4M-$14M/year per year on the artist side, with gross catalog revenue and ownership context separated below.

Why does ABBA still make money?

Repeat streaming and playlist familiarity help the biggest songs keep earning after release. Broad recognition supports social reuse, rediscovery, and steady catalog listening. Licensing and event-driven playback can create recurring spikes.

Who controls ABBA's catalog?

ABBA's page should be read as modeled artist-side annual income, not a public royalty statement. Ownership and label terms can materially change take-home economics.

Sources and References

These notes and links explain the public context used to frame the page. They support a directional model, not an audited royalty statement.

Published by How Much Music using the site methodology. If a source or estimate needs correction, use the contact page.

Evidence used

  • Internal artist data separates gross catalog revenue ($12M-$39M/year) from modeled artist-side share ($4.4M-$14M/year).
  • Publishing and writer lanes are shown separately where available: publisher $1.2M-$3.9M/year; writer $1.8M-$5.9M/year.
  • This page is supported by 2 tracked top songs: Dancing Queen, Gimme! Gimme! Gimme! (A Man After Midnight).
  • Ownership fields include master context, publishing context, catalog-sale status.
  • Catalog metadata lists genre: Pop; country: Sweden; active since: 1972.

Editorial context

  • Dancing Queen and Gimme! Gimme! Gimme! (A Man After Midnight) remain the clearest catalog anchors for the page.
  • Pop catalog streaming supports recurring long-tail demand.
  • Publishing, licensing, and ownership splits can materially change the artist-side share versus gross catalog revenue.

Methodology limits

  • The estimate is a modeled annual range, not a public royalty statement from the artist, estate, label, publisher, or distributor.
  • Gross catalog revenue, artist-side share, label share, publisher share, and writer share are separated only where structured split data exists.
  • Top-song links and platform references are public context signals; they are not audited payout disclosures.
  • Catalog sale fields are included only where present in the local data; absence of a sale adjustment does not prove no transaction exists.
Show ownership and assumptions

ABBA's page should be read as modeled artist-side annual income, not a public royalty statement. Ownership and label terms can materially change take-home economics.

Supporting Revenue Context

Estimated gross catalog revenue$12M-$39M/year
Estimated artist or estate cut$4.4M-$14M/year
Estimated label share$4.2M-$13M/year
Estimated publisher share$1.2M-$3.9M/year
Estimated writer share$1.8M-$5.9M/year

Assumptions: Estimate keeps ABBA's current headline range as the artist-side figure and models gross catalog, label, publishing, and writer lanes from that conservative annual range.

Ownership and Catalog Status

MastersLikely split across label, distributor, and artist-affiliated rights depending on recording era
PublishingWriter and publisher splits materially affect final artist-side income
Catalog sale statusNo full catalog sale assumption baked into this modeled range

Notes: ABBA's page should be read as modeled artist-side annual income, not a public royalty statement. Ownership and label terms can materially change take-home economics.

Split-aware estimate

The primary figure is the modeled artist-side or estate-side annual cut, not gross catalog revenue.

  • Gross catalog revenue is shown separately when enough context exists to distinguish top-line catalog value from artist-side take-home.
  • Ownership notes are available here and can materially change who actually keeps the revenue shown on the page.
  • All figures are conservative annual modeled ranges based on streaming scale, catalog age, licensing usefulness, and known ownership context, not audited royalty statements.

Read the full methodology.

More Context

Related Artists

Key Career Highlights

  • Known for: ABBA remains closely associated with Dancing Queen and Gimme! Gimme! Gimme! (A Man After Midnight), which still anchor attention around the catalog.
  • Highlight: Songs like Dancing Queen and Gimme! Gimme! Gimme! (A Man After Midnight) still help define the catalog's long-tail earnings profile.

Editorial Insight

ABBA's page is strongest when read as a split-aware catalog model: the useful number is not just gross demand, but how much of that demand can plausibly reach the artist side.